Store everything on S3 with
DuckDB-powered analytics
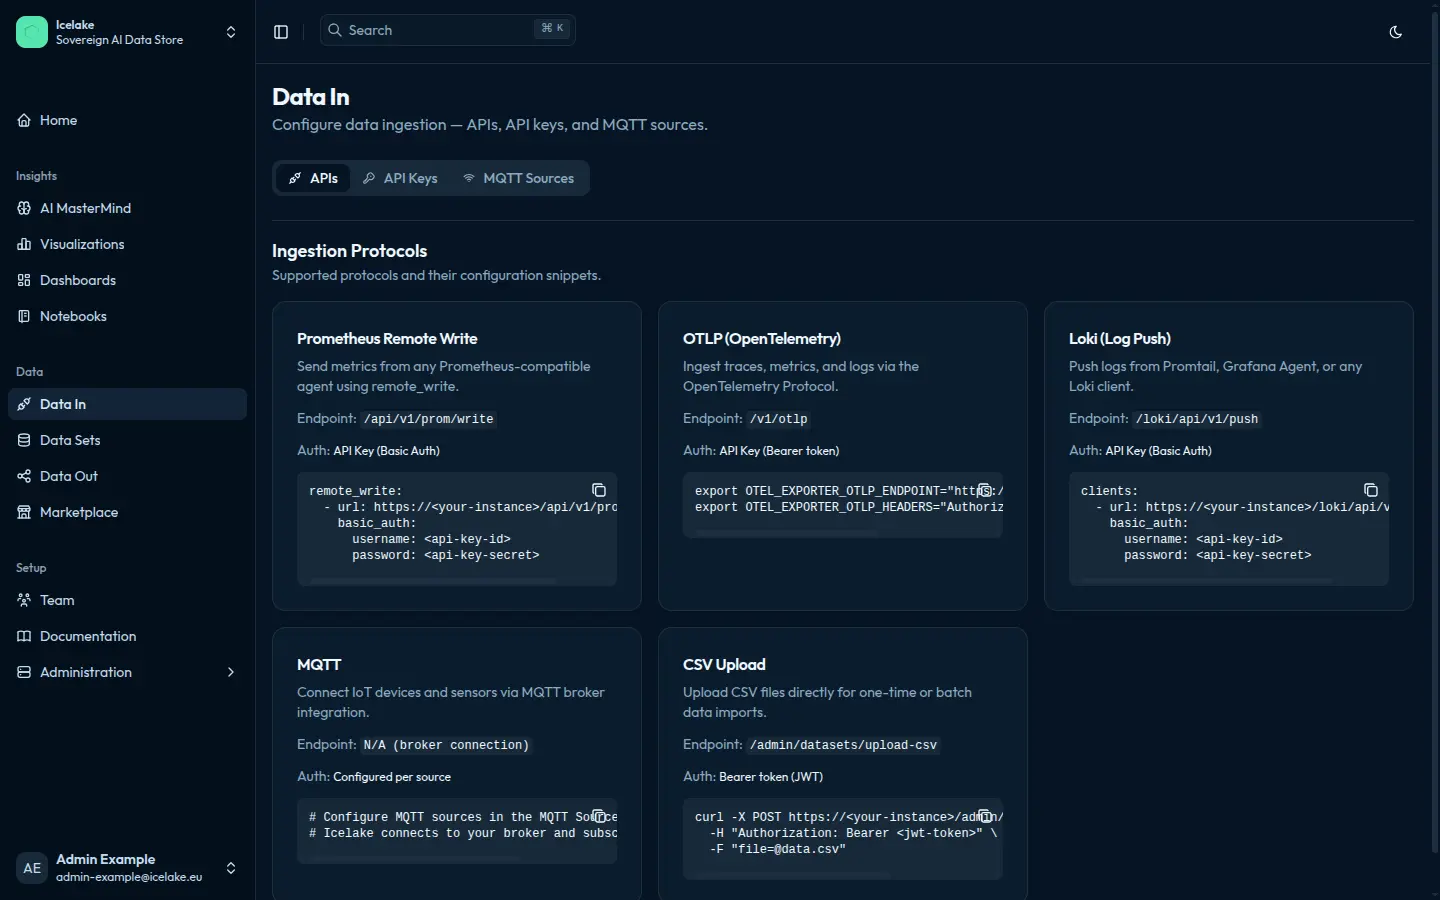
Ingest via Prometheus, Loki, OpenTelemetry, and MQTT. Query with SQL, LogQL, and AI MasterMind. Store on S3 — not disks. One managed platform, live in minutes.
Full-stack observability with AI-powered analytics
EVERY SIGNAL TYPE. ONE PLATFORM. ZERO DISKS.
Architecture That Scales — Costs That Don't
One managed platform handles ingestion, storage, compaction, querying, and AI analytics. No disks — everything on S3. No sidecars — everything built in.
Multi-Protocol Ingestion
Prometheus remote write, Loki push API, OpenTelemetry OTLP, and MQTT — all on one managed endpoint.
S3 Lakehouse Analytics
DuckDB-powered analytics on S3-native storage. SQL, LogQL, and PromQL — with Parquet files optimized by background compaction.
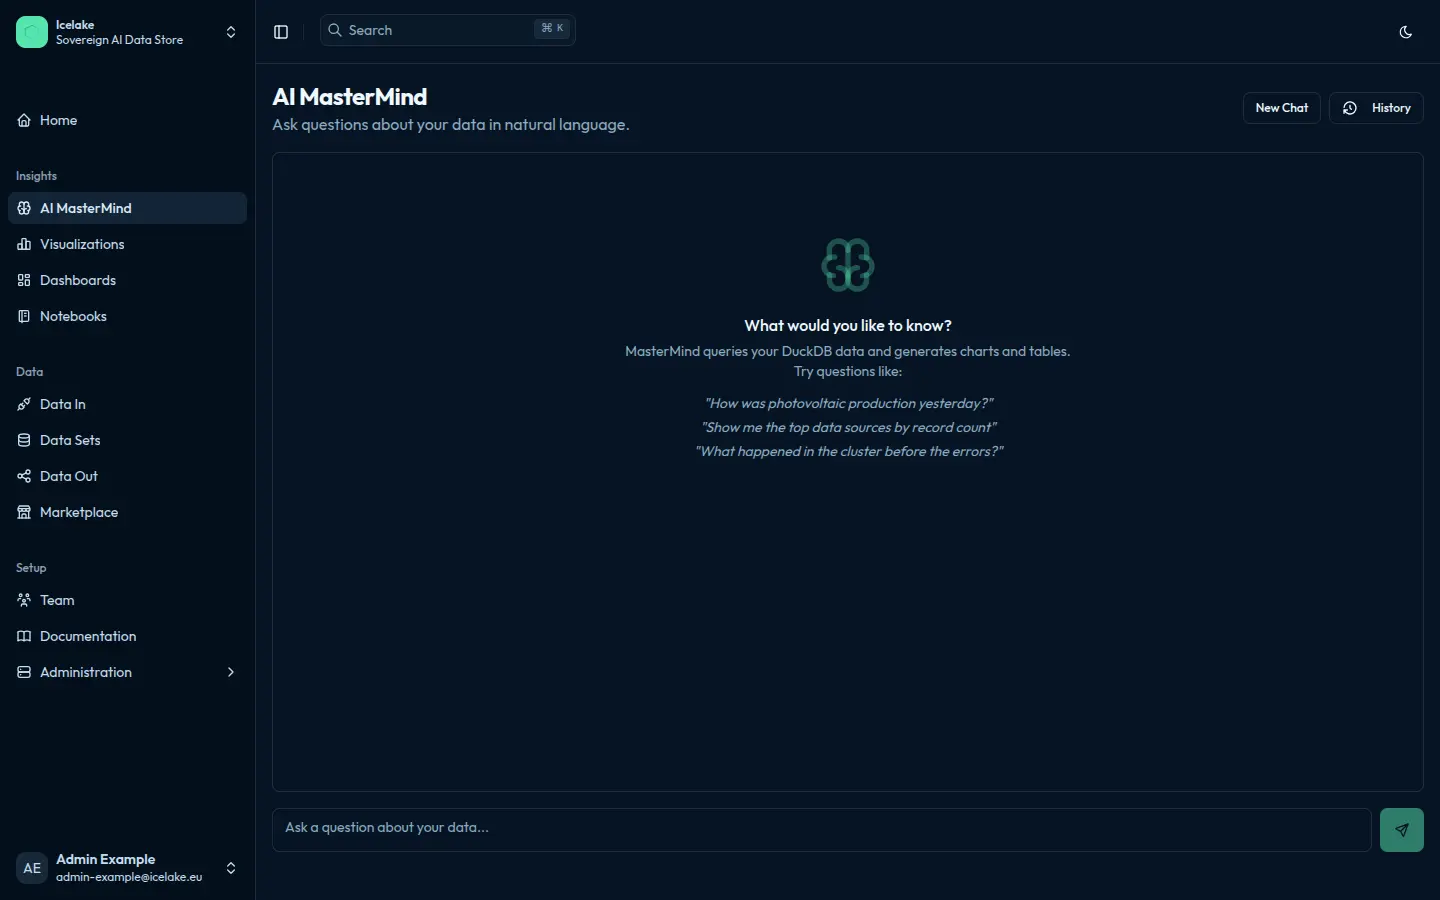
AI-Powered Insights
AI MasterMind chat turns natural language into DuckDB queries on S3. Charts, tables, and anomaly detection — automatically.
Ecosystem Integrations
Works with Prometheus, Grafana, Home Assistant, and any S3-compatible client. Open standards, zero lock-in.
S3 Compaction
Merging 24 Parquet files into optimized segments
Storage: Compacted 2.4GB → 890MB on S3
Team & Access Management
Admin dashboard with team invites, role-based access, API keys, and tenant isolation.
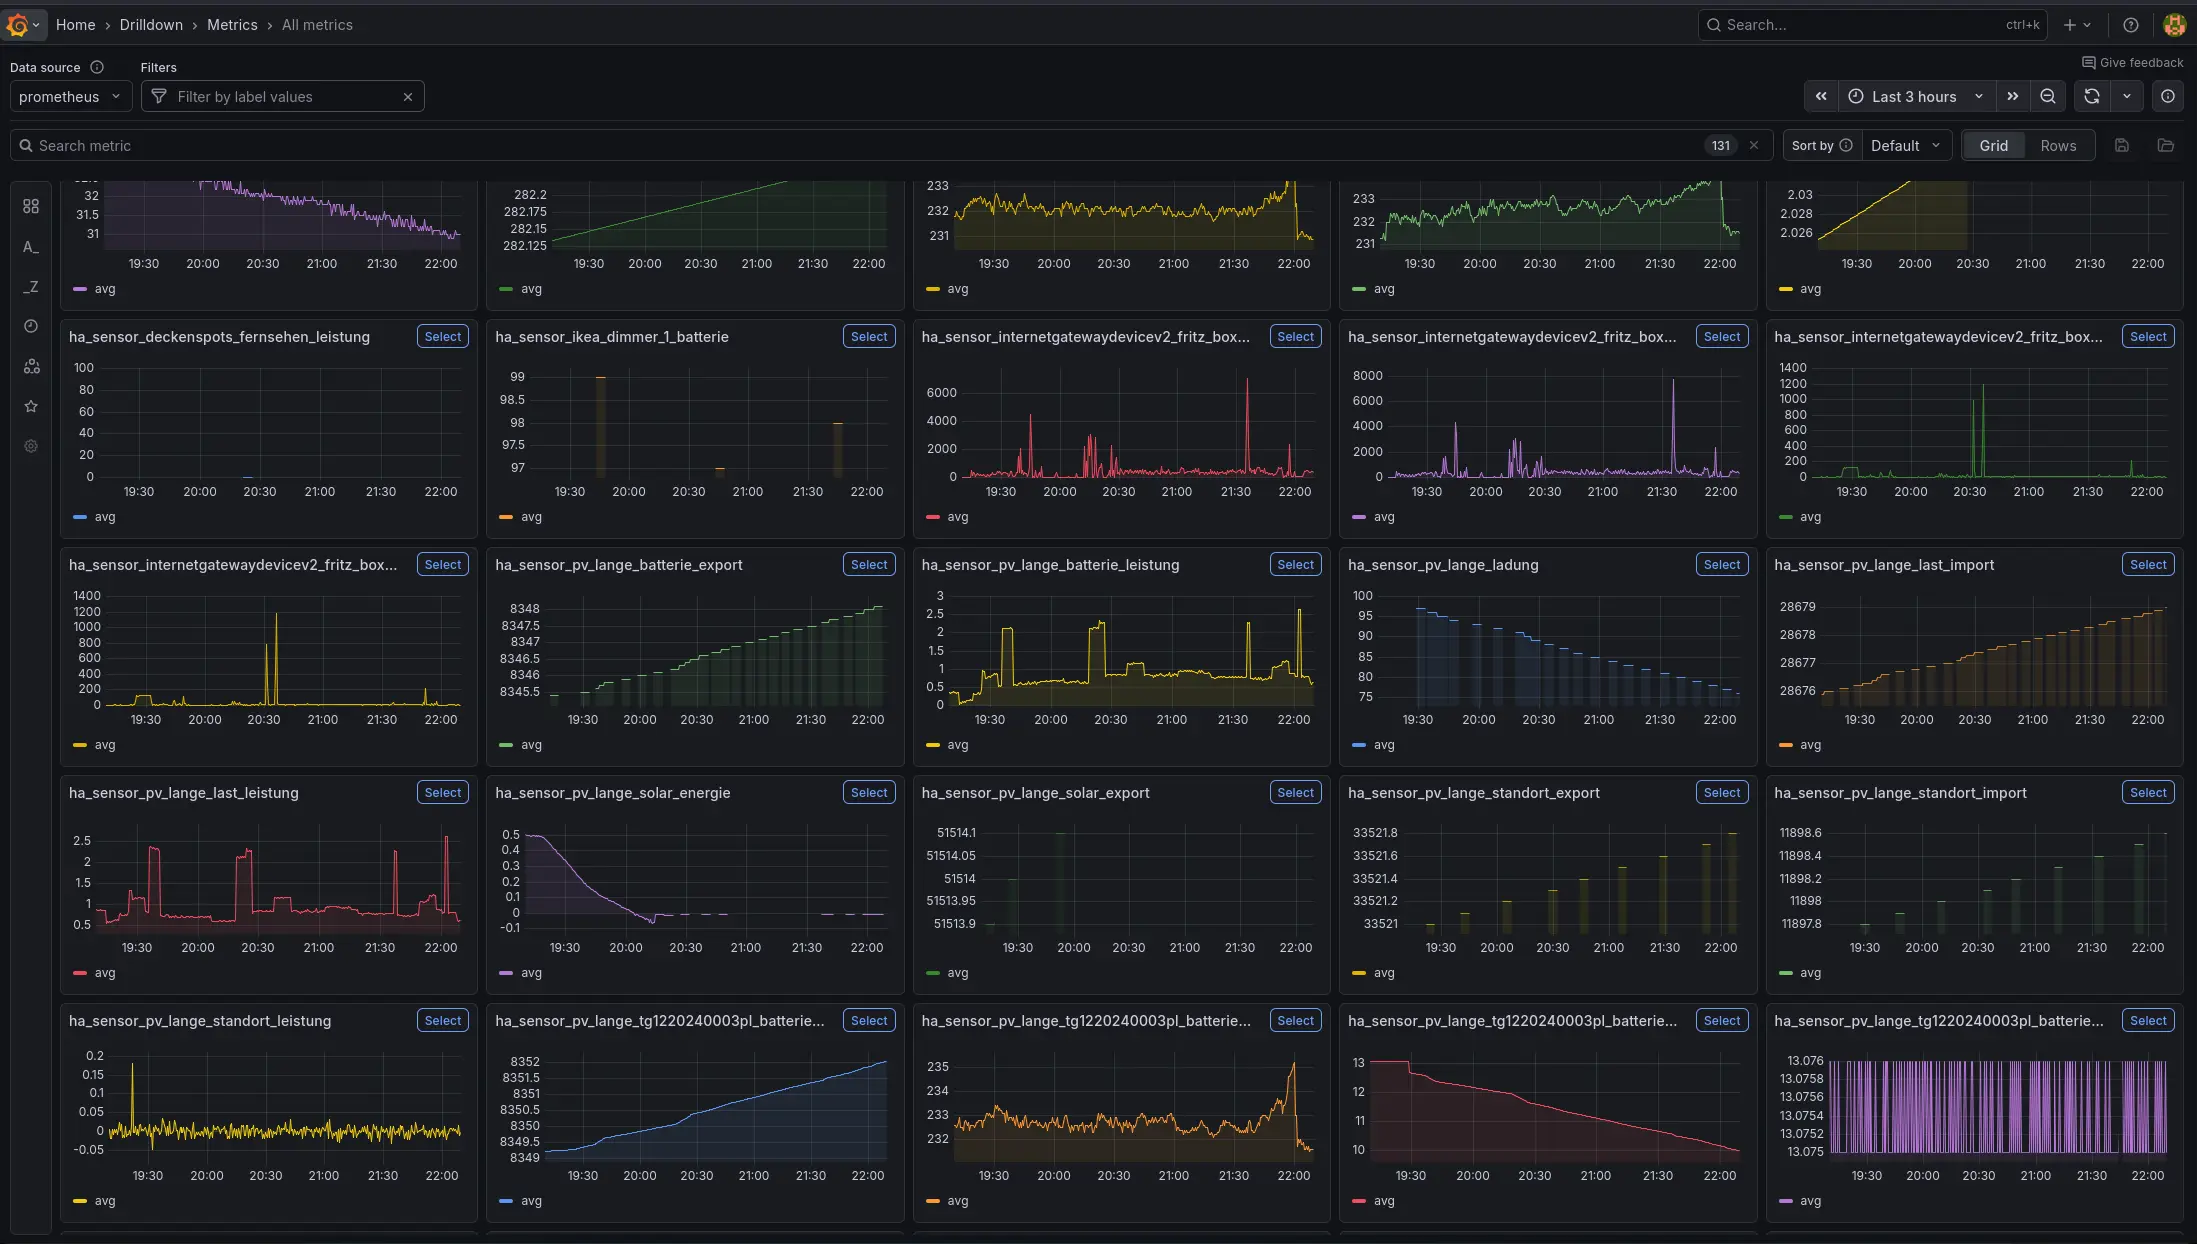
Drill into your data with Grafana, natively
Icelake speaks the Prometheus and Loki query APIs. Point Grafana at Icelake as a Prometheus datasource for metrics and as a Loki datasource for logs — no intermediate servers, no custom plugins. Metrics Drilldown works out of the box.
- →PromQL, LogQL, and live tail, backed by Parquet on S3
- →One API key authenticates both ingestion and query
- →Copy-paste Grafana provisioning — up in 5 minutes
Real-Time
Log
Explorer
LogQL-Compatible Query EngineStream logs in real time from any source — application, infrastructure, or IoT. Filter with LogQL, search with full-text, and correlate with metrics. Stored on S3, queryable forever.