Quickstart
Icelake is a fully managed European observability data lakehouse. This guide takes you from zero to “I can see my data in Grafana” in under 5 minutes — no servers on your side to run, nothing to install. You talk to Icelake over the standard Prometheus, Loki, and OpenTelemetry endpoints, and Grafana consumes it back out over the same APIs.
1. Get your Icelake account
Section titled “1. Get your Icelake account”Sign up at app.icelake.eu or contact us if your team needs a pilot environment. Accounts are tenant-scoped and include everything — ingest endpoints, admin UI, pgwire SQL, AI MasterMind, dashboards — out of the box.
2. Create an API key
Section titled “2. Create an API key”In the admin UI, open Data In → API Keys → Create key. You’ll get a client ID and a secret starting with ilk_. Copy the secret now — it’s shown exactly once. The same key authenticates every ingestion and query path.
Export them so the rest of this tutorial picks them up:
export ICELAKE_CLIENT_ID="your-client-id"export ICELAKE_API_KEY="ilk_..."3. Send your first signal
Section titled “3. Send your first signal”Any Prometheus agent, OpenTelemetry Collector, Fluent Bit, or curl can talk to Icelake. The shortest possible smoke test is one curl that pushes a log line into the Loki-compatible endpoint:
curl -X POST https://api.icelake.eu/loki/api/v1/push \-u "$ICELAKE_CLIENT_ID:$ICELAKE_API_KEY" \-H "Content-Type: application/json" \--data-binary @- <<EOF{"streams":[{"stream":{"app":"quickstart"},"values":[["$(($(date +%s) * 1000000000))","Hello from Icelake Quickstart"]]}]}EOFA 204 No Content means it landed. For real data flows, point your existing tools at the managed endpoints:
| Source | Endpoint | Doc |
|---|---|---|
| Prometheus remote write | https://api.icelake.eu/api/v1/prom/push | Prometheus |
| Loki push API | https://api.icelake.eu/loki/api/v1/push | Loki & LogQL |
| OpenTelemetry OTLP HTTP | https://api.icelake.eu/v1/{logs,metrics,traces} | OpenTelemetry |
| MQTT (TTN or your broker) | configured via the admin UI | MQTT |
All of them authenticate with the same client ID + ilk_… secret, either as HTTP Basic auth or as the pgwire username/password pair.
4. Launch Grafana pointed at Icelake
Section titled “4. Launch Grafana pointed at Icelake”Already have a Grafana (cloud or internal)? Skip to the datasource config below. Otherwise, this docker-compose.yml plus a provisioning file brings up a local Grafana with Icelake pre-configured as both a Prometheus and a Loki datasource:
services:grafana: image: grafana/grafana:latest ports: - "3001:3000" environment: - ICELAKE_CLIENT_ID=${ICELAKE_CLIENT_ID} - ICELAKE_API_KEY=${ICELAKE_API_KEY} volumes: - ./grafana/provisioning:/etc/grafana/provisioningapiVersion: 1
datasources:- name: Icelake Metrics type: prometheus access: proxy url: https://api.icelake.eu/prom basicAuth: true basicAuthUser: ${ICELAKE_CLIENT_ID} secureJsonData: basicAuthPassword: ${ICELAKE_API_KEY} isDefault: true
- name: Icelake Logs type: loki access: proxy url: https://api.icelake.eu/loki basicAuth: true basicAuthUser: ${ICELAKE_CLIENT_ID} secureJsonData: basicAuthPassword: ${ICELAKE_API_KEY}Run docker compose up -d. Grafana picks up the datasources on startup — no click-through config needed.
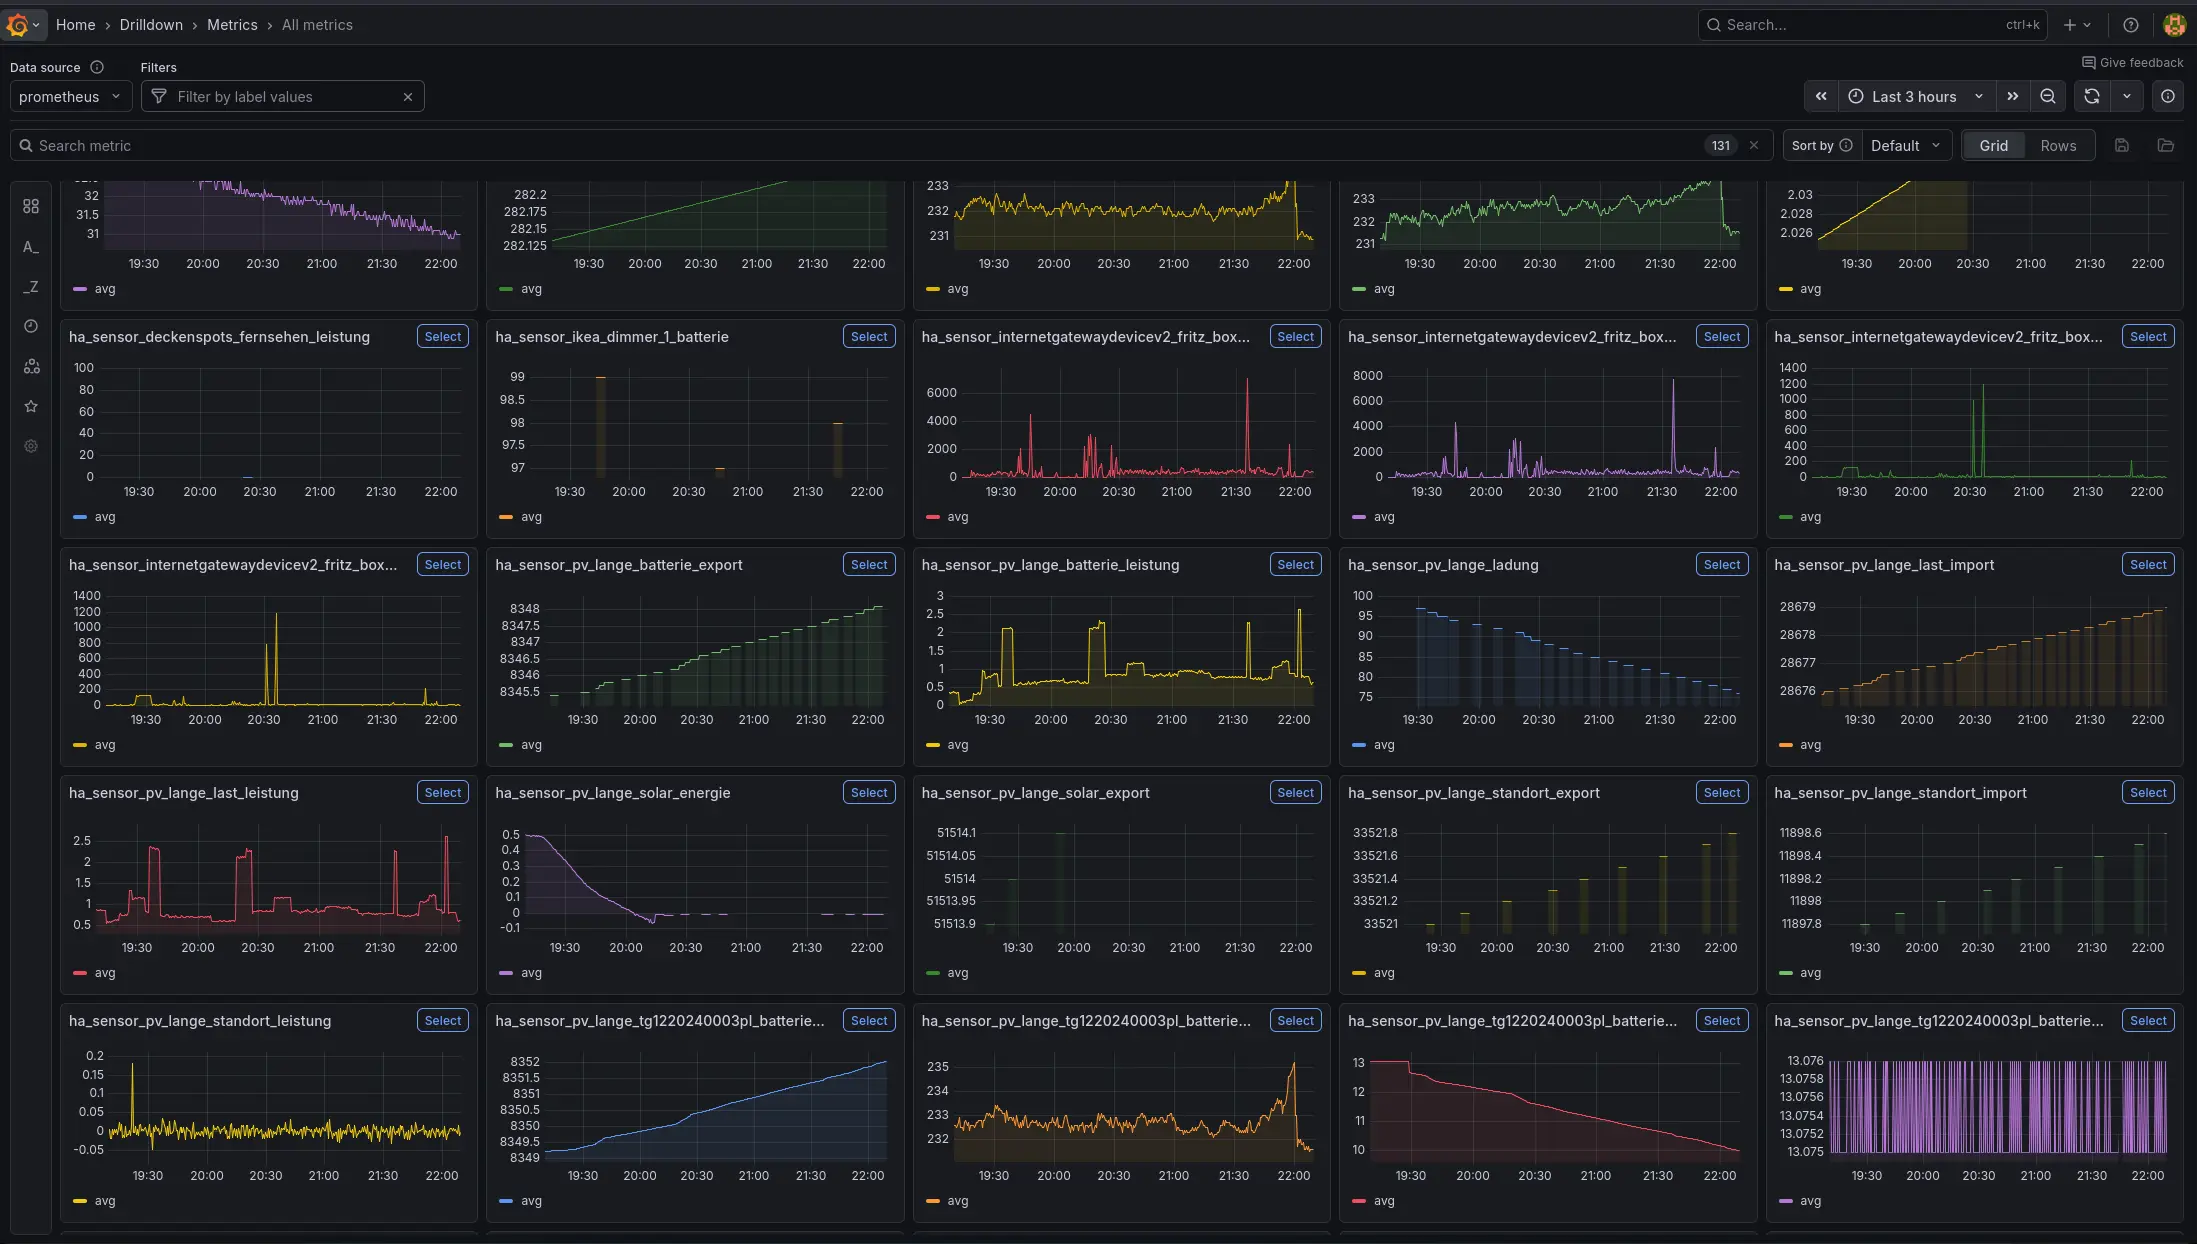
5. Explore in Grafana Metrics Drilldown
Section titled “5. Explore in Grafana Metrics Drilldown”Open http://localhost:3001, sign in (default admin / admin), and head to Explore → Metrics. Grafana reads labels and series directly from Icelake’s Prometheus-compatible /prom/api/v1/* endpoints, so Metrics Drilldown, ad-hoc PromQL, and saved dashboards all work out of the box. Switch the datasource to Icelake Logs for LogQL against your ingested logs.
Next steps
Section titled “Next steps”- Prometheus — remote write configuration and tuning
- Loki & LogQL — log shipping and query examples
- OpenTelemetry — OTLP over HTTP for logs, metrics, and traces
- Query Interfaces — pgwire SQL, REST, and more
- Jupyter Notebooks — VS Code + JupySQL + matplotlib against Icelake
- Admin Dashboard — the built-in UI for dashboards and AI MasterMind