Geo & Public Datasets
Icelake’s geo table is the front door to public data research. Public sources — German weather warnings, EU air quality, live weather radar (DWD RADOLAN) and storm-cell tracking, and free sovereign maps (Overture Maps places, buildings, roads, divisions — no Google or Mapbox keys, no usage tracking) — are ingested by Icelake into a shared __public__ tenant and visible to every account at no extra cost. Your own CSV uploads with a geometry column land in the same table under your tenant, so the same SQL joins work across public and private data.
This is what makes Icelake the go-to address for easy public data access: public data is already at your fingertips, and cross-signal questions like “did solar production drop because a rain warning was active over this address?” are one query instead of three pipelines.
What you get out of the box
Section titled “What you get out of the box”| Source | source_id | name values | Cadence |
|---|---|---|---|
| DWD | dwd | weather_warning | every 5 min |
| OpenAQ | openaq | pm25, pm10, o3, no2, so2, co | every 60 min |
| Overture | overture | place, division, building, road | per release (~weekly, on-demand) |
| Rainradar | rainradar | rainradar | every 5 min |
| Stormcells | stormcells | stormcells | every ~5 min (live) |
| Your CSV | yours | yours | per upload |
- DWD severe-weather warnings — every active warning polygon (rain, storm, snow, ice, heat, …) for German municipalities, with severity, onset, expiry, and human-readable description.
- OpenAQ air quality — latest reading per station for six pollutants across the EU and beyond, with units, station name, and lat/lon.
- Overture Maps — the open, vendor-neutral basemap. We import the EU bounding box; you query places (schools, hospitals, transit), administrative divisions (countries → neighbourhoods), buildings, and roads in WGS84 GeoJSON.
- DWD RADOLAN weather radar — live 5-minute rain-radar frames as Cloud-Optimized GeoTIFFs, served as free map tiles via
tiles.icelake.eu. See Live weather radar. - Storm-cell tracking — convective cells tracked frame-to-frame with motion vectors and a forecast cone, on a public GeoJSON endpoint. See Real-time storm cells.
- Customer CSVs — upload a CSV with a
geometrycolumn (WKT or GeoJSON) and it lands ingeounder your tenant, joinable against everything above.
Schema
Section titled “Schema”One table, append-only with versioning:
geo ( timestamp TIMESTAMP NOT NULL, -- event/observation time tenant_id VARCHAR NOT NULL, -- '__public__' for shared sources source_id VARCHAR NOT NULL, -- 'dwd' | 'openaq' | 'overture' | <your source> name VARCHAR NOT NULL, -- pollutant code, theme name, layer name geometry GEOMETRY NOT NULL, -- query with ST_*; render with ST_AsGeoJSON() value DOUBLE, -- scalar reading (NULL for non-numeric features) labels JSON, -- source-specific properties valid_until TIMESTAMP, -- expiry for time-bounded features description VARCHAR, feature_id VARCHAR, -- stable identity across polls received_at TIMESTAMP NOT NULL, polled_at TIMESTAMP NOT NULL -- snapshot/version stamp)Every poll cycle and every CSV upload writes a fresh polled_at stamp. Older versions of the same feature_id stay queryable — read-side queries pick the version semantics they want (latest, point-in-time, or full history).
Query patterns
Section titled “Query patterns”All queries below run over Icelake’s pgwire SQL endpoint at
sql.icelake.eu:5432— see Query Interfaces for the connection string. Thegeotable is automatically visible across__public__and your own tenant.
Active weather warnings right now
Section titled “Active weather warnings right now”SELECT name, labels->>'severity' AS severity, labels->>'event_type' AS event, description, ST_AsGeoJSON(geometry) AS geometryFROM geoWHERE tenant_id = '__public__' AND source_id = 'dwd' AND name = 'weather_warning' AND timestamp <= now() AND (valid_until IS NULL OR valid_until > now())QUALIFY row_number() OVER (PARTITION BY feature_id ORDER BY polled_at DESC) = 1;The QUALIFY keeps one row per logical warning — the most recently polled version.
Latest PM2.5 readings inside a bounding box
Section titled “Latest PM2.5 readings inside a bounding box”SELECT description AS station, value AS pm25_ugm3, timestamp, ST_AsGeoJSON(geometry) AS geometryFROM geoWHERE tenant_id = '__public__' AND source_id = 'openaq' AND name = 'pm25' AND ST_Intersects(geometry, ST_MakeEnvelope(9.5, 53.4, 10.4, 53.8)) -- Hamburg-ishQUALIFY row_number() OVER (PARTITION BY feature_id ORDER BY polled_at DESC) = 1;Schools inside a named neighbourhood
Section titled “Schools inside a named neighbourhood”WITH bounds AS ( SELECT geometry AS shape FROM geo WHERE source_id = 'overture' AND name = 'division' AND labels->>'subtype' = 'neighborhood' AND labels->>'name' = 'Sankt Jürgen' LIMIT 1)SELECT json_extract_string(p.labels, '$.name') AS school_name, ST_AsGeoJSON(p.geometry) AS geometryFROM geo p, bounds bWHERE p.source_id = 'overture' AND p.name = 'place' AND json_extract_string(p.labels, '$.category') = 'school' AND ST_Intersects(p.geometry, b.shape);In AI MasterMind, you’d skip the CTE entirely — just ask “how many schools are in Sankt Jürgen, Lübeck?”. See AI MasterMind.
Cross-signal — your IoT sensor inside an active warning polygon
Section titled “Cross-signal — your IoT sensor inside an active warning polygon”This is the killer query. Your Home Assistant or LoRaWAN sensor lands in metrics with lat/lon labels. Join it against geo:
SELECT m.timestamp, m.metric_name, m.value, w.description AS warningFROM metrics mJOIN geo w ON w.tenant_id = '__public__' AND w.source_id = 'dwd' AND w.name = 'weather_warning' AND m.timestamp BETWEEN w.timestamp AND COALESCE(w.valid_until, now()) AND ST_Contains( w.geometry, ST_Point(CAST(m.labels->>'lon' AS DOUBLE), CAST(m.labels->>'lat' AS DOUBLE)) )WHERE m.metric_name = 'pv_power_watts' AND m.timestamp >= '2026-05-10T00:00:00Z' AND m.timestamp < '2026-05-13T00:00:00Z';Every PV reading from a sensor inside an active rain or storm polygon — in one statement, across three data sources you didn’t have to build pipelines for.
Live weather radar (RADOLAN)
Section titled “Live weather radar (RADOLAN)”Icelake ingests DWD RADOLAN weather radar — Germany’s national rain-radar network — and serves it as free map tiles. A converter pulls the 5-minute RADOLAN products (rainfall intensity in mm/h plus reflectivity composites) straight from DWD OpenData, writes each frame as a Cloud-Optimized GeoTIFF (COG) to object storage, and records the frame in the geo table under source_id = 'rainradar'.
You consume it two ways:
- As map tiles — each frame’s
labelscarry a ready-to-usetile_urlpointing at Icelake’s COG tile server:https://tiles.icelake.eu/cog/tiles/{z}/{x}/{y}.png?url=<s3-path>. Drop it into any{z}/{x}/{y}raster layer (MapLibre, Leaflet, OpenLayers). No keys, no Mapbox, EU-served. - As
georows — query frame metadata (timestamp, product, bounding geometry,max_mm_h) in SQL like any other source.
SELECT timestamp, labels->>'product' AS product, -- e.g. 'RY' (5-min rainfall mm/h) labels->>'tile_url' AS tile_url, value AS max_mm_hFROM geoWHERE tenant_id = '__public__' AND source_id = 'rainradar'QUALIFY row_number() OVER (PARTITION BY feature_id ORDER BY polled_at DESC) = 1;Read the
tile_urlfrom the latest frame and let the tile server render it — don’t try to read the COG pixels directly from SQL. The live radar layer is also viewable, with no setup, on the public map at maps.icelake.eu.
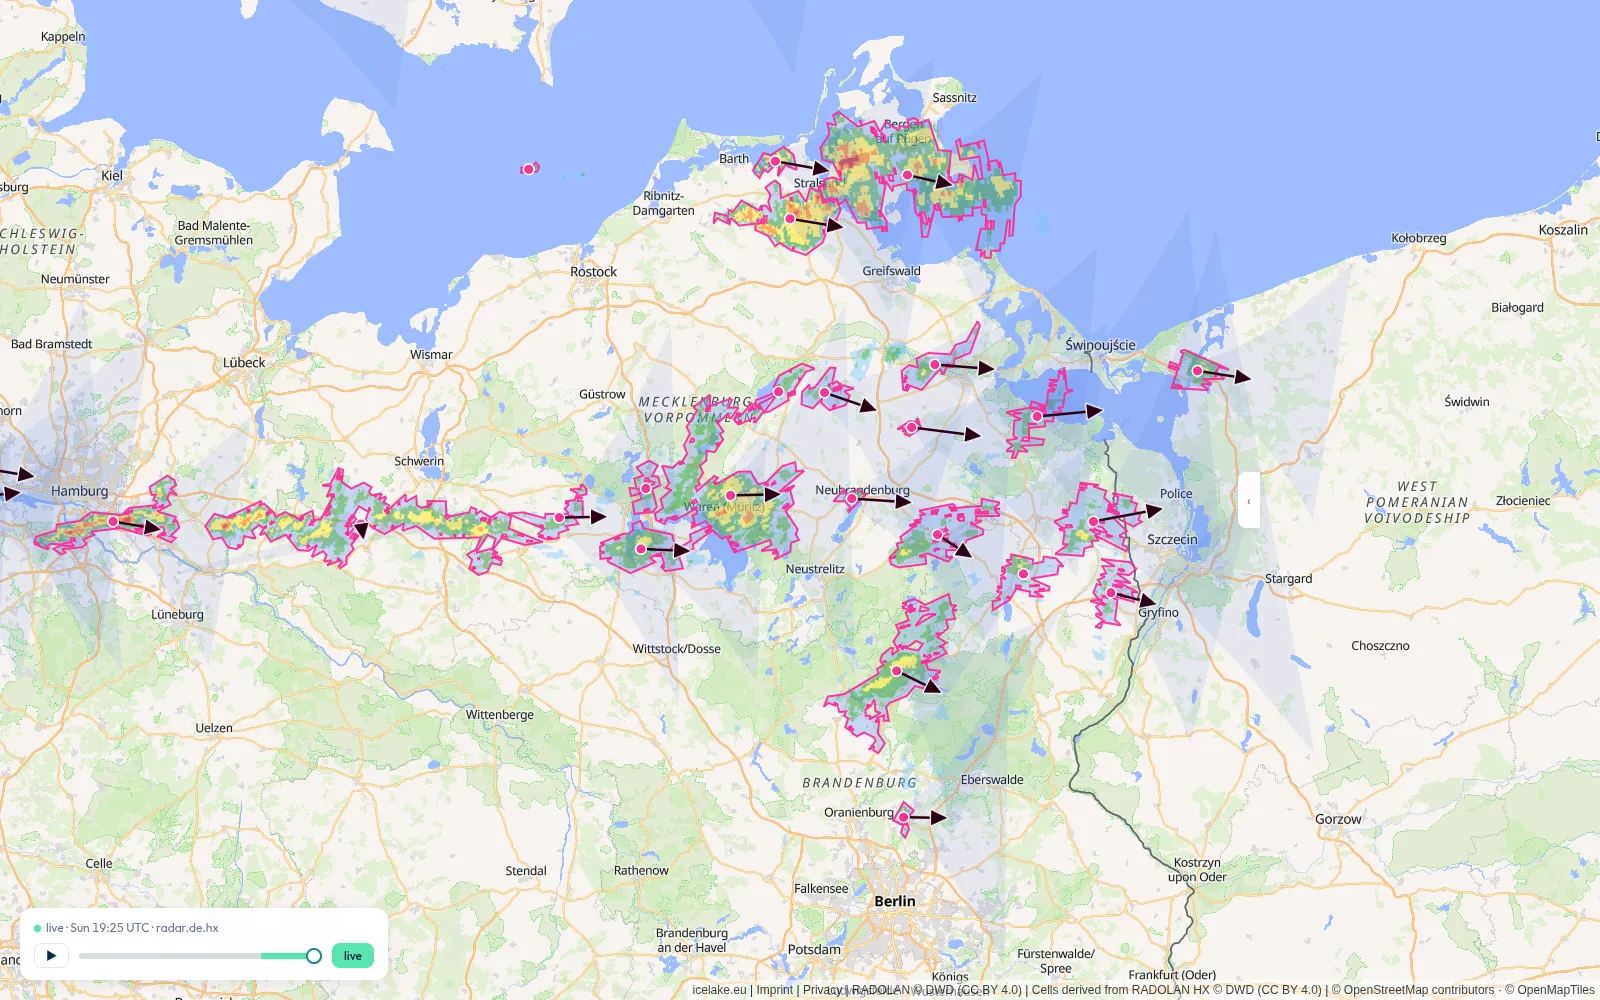
Real-time storm cells
Section titled “Real-time storm cells”Beyond the static geo table, Icelake tracks live convective storm cells and exposes them on a public, no-auth GeoJSON endpoint built for map overlays:
GET https://api.icelake.eu/api/v1/geo/stormcells.geojson ?at=2026-05-07T14:00:00Z # RFC3339 instant — defaults to the latest frame &minutes_ahead=12 # 0–60, forward-projects each cell along its track (default 12) &bbox=6,47,15,55 # lng_min,lat_min,lng_max,lat_max in WGS84 — optional spatial filterThe response is a standard GeoJSON FeatureCollection. Each cell carries its current rain-envelope polygon plus a centroid, velocity, and bearing, so you can draw motion arrows or animate the projected position minutes_ahead into the future. The collection also reports total_coverage_km2. Drop the URL straight into MapLibre, Leaflet, or any GeoJSON-aware client.
The same cells are queryable in SQL under source_id = 'stormcells', so you can correlate them against your own sensors exactly like the warning-polygon query above.
Customer geo data
Section titled “Customer geo data”Upload a CSV with a column called geometry containing WKT (POINT(lon lat), POLYGON(...)) or GeoJSON, and Icelake routes it into the geo table under your tenant. Joining your routes, service areas, or asset locations against DWD warnings or Overture places then works the same way as the queries above — just drop the tenant_id = '__public__' filter (or change it to tenant_id IN ('__public__', '<your-tenant>') to query both).
See CSV Upload for the upload flow.
Visualising results
Section titled “Visualising results”Any SQL result with a geometry column rendered as ST_AsGeoJSON(geometry) shows up as a map in the admin UI:
- SQL Workbench (Insights → SQL Workbench) — run a SQL query, get a map alongside the table view automatically.
- Visualizations — save a geo-flavoured query as a reusable map visualization for dashboards.
- AI MasterMind — natural-language map answers; the LLM emits the right
ST_AsGeoJSONprojection automatically.
Append-only — don’t DELETE or UPDATE
Section titled “Append-only — don’t DELETE or UPDATE”The geo table is append-only by design. To “remove” a feature, write a new row with a tombstone label (labels.deleted = true) — the latest-version dedup pattern above naturally elides it. Direct DELETE/UPDATE against geo is rejected.
Related
Section titled “Related”- AI MasterMind — natural-language queries that join geo against metrics and logs.
- Query Interfaces — pgwire, REST SQL, and Grafana.
- CSV Upload — bring your own geo data.